26.10.2026


Four plants, four established ordering channels, and a purchasing manager who has to guess when preparing the quarterly report. The problem rarely lies with the reporting tool, but rather with the fact that a significant portion of orders never make it into the system. This article shows which channels are regularly missing, the order in which you should proceed, and which metrics a corporate group actually needs.
Transparency regarding indirect expenses doesn’t come from the dashboard—it comes from the database. As long as individual plants place orders through their own online stores, vending machines, and small suppliers, every corporate report will remain incomplete. The process should follow this sequence: consolidate all ordering channels into a single system, standardize cost centers and product groups across the group, and then analyze the data.
The most important points at a glance:
The typical finding in corporate groups is not “we don’t have any figures,” but rather “we have four separate sets of figures.” Each plant knows its own expenses, but no one knows the group’s total—and the sum of the four plants does not reflect the reality, because each plant defines its scope differently.
Definition: Expenditure transparency in indirect procurement refers to a complete, cross-site view of which organizational unit procures which product group from which supplier at what price.
The word “complete” carries the weight here. An analysis covering 70 percent of the volume is worthless for negotiations: You don’t know whether the supplier ranked seventh on your list might actually be ranked second across the entire group. It is precisely this gap that arises from the channels operating alongside the platform.
The use case for decentralized procurement with centralized cost control: Locations continue to place orders independently, yet the analysis is still consolidated in one place.
First, check what’s missing from your analysis. In most corporate groups, it’s the same four channels.
|
Missing channel |
Why it occurs |
Impact on the analysis |
|---|---|---|
|
Direct ordering from the supplier’s online store |
Established relationship with the supplier, faster than the official channel |
Supplier lacks volume; bargaining position weakens |
|
Shop floor withdrawal from dispensing machines |
Withdrawals are not considered orders internally |
Consumption only appears in the replenishment process, never as a requirement |
|
One-time purchases from very small suppliers |
No framework agreement; often billed without a purchase order |
Tail spend remains invisible; the vendor master database grows |
|
Marketplace orders placed via personal or team accounts |
Item is not available in the catalog |
Costs bypass cost centers and product groups |
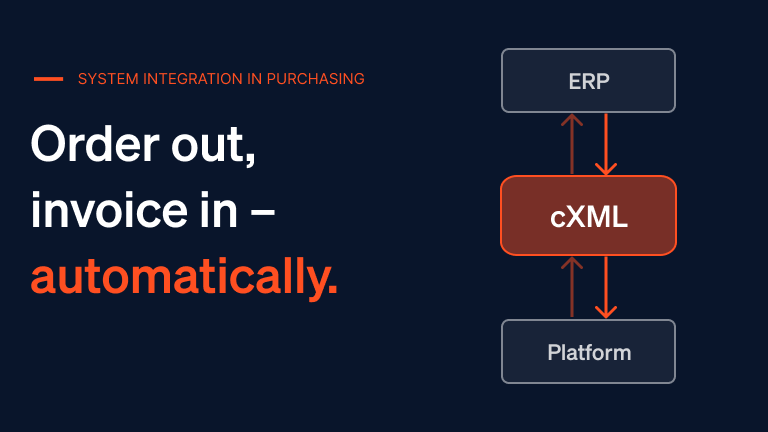
There is a technical solution for the first two channels: External ordering systems such as dispensing and logistics systems are centrally integrated into the platform, where cost allocation and budgets also apply. For the last two, a broader catalog is needed instead of restrictions—via long-tail solutions allow marketplace needs and in-house catalogs to be integrated rather than excluded.
Tip: Don’t block missing ordering channels; integrate them instead—a blocked channel disappears from the analysis, not from the company.
The order determines the outcome. Those who start with reporting quickly end up with a nice-looking dashboard based on incomplete data and thus lose the trust of the plants—usually permanently.
Steps two and three are the least popular. Nevertheless, they determine whether the end result is a management tool or just a series of slides. The use case for Purchasing Reports for Executive Management.
We go through your location structure and show you which share of your indirect volume runs through a system and which bypasses your analysis. No obligation and no preparation needed.
Group-wide procurement rarely fails because of too few key metrics, but rather because of too many. These six are the backbone of management.
|
Key Metric |
What it answers |
Typical Consequence |
|---|---|---|
|
Order volume per location and time period |
Where exactly are the expenses occurring? |
Prioritizing which plant to connect first |
|
Top suppliers across the group |
What is our actual volume with each individual supplier? |
Framework agreement instead of four individual terms |
|
Distribution by product category |
Where is demand spread across too many suppliers? |
Consolidation and RFP |
|
Price variance for the same item across plants |
Are we paying different prices for the same part? |
Immediate adjustment to the best price |
|
Percentage of orders outside the catalog |
How large is the unmanaged volume? |
Catalog expansion instead of a ban |
|
Budget utilization by cost center |
Which unit is heading toward a budget overrun? |
Countermeasures for the current quarter |
Key Fact: The price variance is the metric that provides the quickest path to results. If three departments order the same item from different suppliers with a 22 percent price difference, consolidating orders for a product group with a volume of 200,000 euros yields approximately 44,000 euros—and that’s in a single product group. The full calculation is included in our report, how procurement saves EBIT.
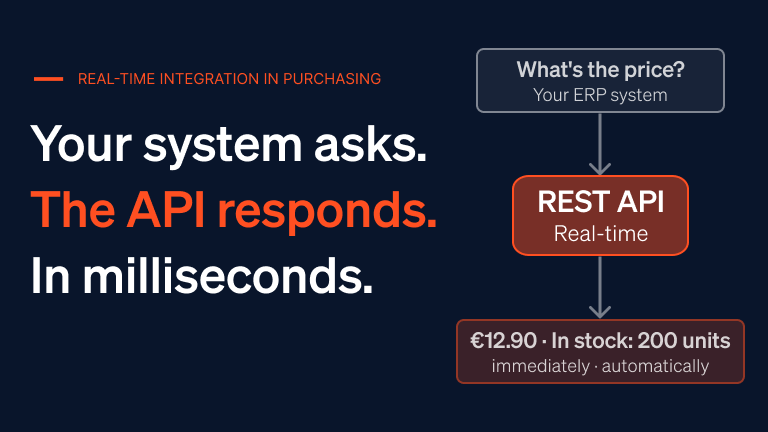
To ensure these metrics are accurate not just at month-end, real-time data is required. Budgets and consumption levels in the controlling package update with every order, group reports consolidate data across locations, and you use access rights to control which location management team receives which view.
Three approaches are common in the German-speaking market, and they differ less in terms of analysis than in the source of the data.
|
Approach |
Data Source |
Strength |
Limitations |
|---|---|---|---|
|
Spend analytics module of a suite (SAP Ariba, Coupa, JAGGAER, Ivalua) |
Proprietary purchase order and contract data, supplemented by classification services |
Covers both direct and indirect materials in a single model |
Benefits depend on all units actually using the suite |
|
BI analysis based on ERP data |
Vendor and invoice data from the ERP |
Fully integrated with invoices; no new platform required |
Displays costs only after posting; no item or demand view |
|
Procurement platform with group-wide reports (Simple System, Onventis, Wucato) |
Order data from all connected channels, including vending machines and marketplaces |
Real-time, item-level visibility; up and running in weeks |
Applies only to the volume that runs through the platform |
The honest assessment: Each of the three approaches has the same Achilles’ heel, just in a different place. The suite is as comprehensive as its rollout, the BI analysis as up-to-date as the transaction, and the platform as comprehensive as its channel coverage. That’s why the first question to ask any provider isn’t “What reports are available?” but “What percentage of our indirect volume can we realistically see with this?”
The fact that the indirect segment is the most lucrative aligns with the assessment by McKinsey’s assessment of trends in procurement. The basis for measuring the effort per transaction is provided by the HTWK Leipzig for managing indirect procurement.
A comprehensive spend report is not an end in itself, but rather a basis for negotiation. Based on the six key metrics, three measures emerge that actually generate savings: consolidating suppliers, bundling demand, and reclaiming unmanaged volume.
The use case on optimizing the supplier structure. For unmanaged volume, the approval workflow in purchasing is the appropriate lever, because budget limits and product range constraints make the official route the most convenient one. If you’d like to start by clarifying the terminology, you’ll find it under indirect demand.
Based on our experience from customer projects: Strategic decisions based on data rather than gut instinct typically account for 5 to 15 percent of the indirect purchasing volume.
If you can’t quantify the first point, that’s exactly where the project begins—not with the dashboard.
Transparency of expenses across multiple locations depends entirely on channel coverage, not on the reporting tool. Anyone who aggregates all ordering channels, standardizes cost centers and product categories, and limits themselves to six key metrics can manage a corporate group effectively.
Order volume per location, top suppliers across the group, price differences between plants. You bring your location structure, we show you the matching analysis.
By first bringing all ordering channels into one system, then standardizing cost centers and product categories across locations, and only then analyzing the data. A group report based on incomplete data leads to wrong negotiation decisions.
Four channels: direct orders in supplier web shops, withdrawals from vending machines in production, one-off purchases from very small suppliers without an ordering process and marketplace orders via team accounts.
Order volume per location, top suppliers across the group, distribution by product category, price differences for the same item between plants, the share of orders outside the catalog and budget utilization per cost center.
For a cost view, yes; for control, no. ERP data is complete but only shows spend after it has been booked and without reference to individual items. This means bundling potential at item level remains invisible.
Because the demand remains. A blocked channel disappears from the analysis, not from the company, so purchasing loses transparency instead of gaining it. It is more effective to connect these channels and manage them through catalogs and budgets.