The profit is in procurement
Calculate your savings potential in just a few steps. Book a free appointment and we will show you individually how to reach this potential. No cost and no risk!
The levers in procurement are far bigger than most people assume.
A 1% cost saving raises profit by up to 10%.
And the item price is often only the smallest part of it!
Most procurement organizations optimize the wrong lever. Anyone who only compares item prices ignores up to 80% of the actual procurement costs.
simple system starts exactly here: not at the price per screw, but at the total cost per procurement transaction. From the requisition to the booked invoice. The result: up to 26% more EBIT, without a single euro of additional revenue.
Thomas Au ist CFO und kümmert sich um alles mit Zahlen.
Außer dem Preis zwischen Ihnen und Ihren Lieferanten - denn simple system ist neutral!
Example calculation at €100M revenue
At an industry-typical EBIT margin of ~6%, the result rises to ~7.6%, an improvement of ~26%, without a single euro of additional revenue.
Calculate your savings potential in just a few steps. Book a free appointment and we will show you individually how to reach this potential. No cost and no risk!
Please select your economic sector. We then determine your individual savings potential, taking into account industry-specific characteristics from our customer data and studies by HTWK Leipzig.
Nutzen Sie den Schieberegler „Jährliches Einkaufsvolumen“, um das Volumen zu definieren. Auf Grundlage unserer Erfahrungen haben wir die Bestellungen pro Jahr und die Bestellpositionen pro Jahr bereits angepasst.
Selbstverständlich können Sie die Daten mit Ihren exakten Informationen überschreiben.
We are confident that with our 25 years of experience and your information, we can unlock significant savings for you. Enter your data and we will send you a PDF full of insights. Feel free to book a free 15-minute appointment and we will find out together how you can realize savings too.
Total / Year
–
– compared to your current cost base
Unlock 15 more metrics & a detailed analysis
What you get:
Analysis for
Savings with simple system:
–
This is how much you save per year with simple system. At a purchasing volume of $EINKAUFSVOLUMEN, that equals $ERSPARNIS of your current procurement costs.
Note your report ID to revisit the report anytime or download it directly as a PDF.
Today
–
With simple system
–
Broken down
Full costs
–
–
€ per Article
–
–
Order processes
–
–
Skonto usage
–
–
Process costs
–
–
Over 3 years that equals –
The biggest cost driver in indirect procurement is not the item, it is the process around it. According to the HTWK study, a manually processed order costs an average of €146, a digitally processed one only €86. That is €60 saved per transaction, regardless of whether the cart is €50 or €500.
Example: A company with €100M revenue and 5% procurement volume through simple system generates around 16,667 orders per year.
The process cost savings: ~€1.0M, straight into EBIT.
Key insight: anyone who negotiates an item price for 10 minutes but needs 45 minutes for the order is optimizing the wrong end.
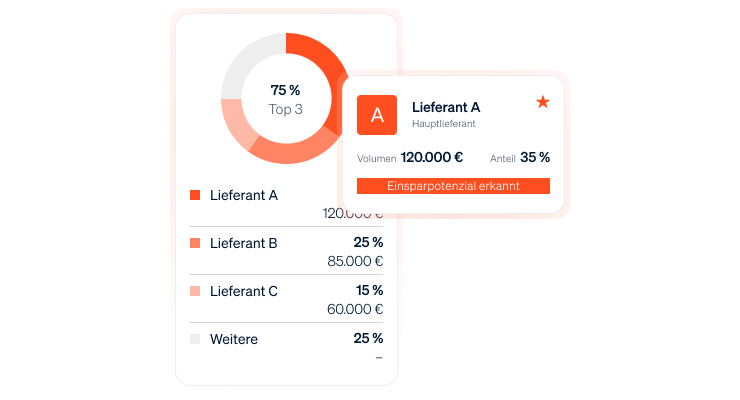
Every additional vendor means more overhead. From accounts-payable setup and vendor vetting to price negotiations. With a focused procurement process you bundle fewer vendors into one process. Consolidation not only reduces administrative effort, it also creates negotiating power through bundled volume.
Example: At least 12.5% savings on the consolidated procurement volume through bundling effects, framework terms and eliminated vendor administration. At €5M purchasing volume that is €625,000 per year.
Key insight: consolidation does not mean dependency. simple system is neutral, no own trading, no hidden margins. The platform works for the buyer, not for the vendor.
When departments order around procurement, negotiated terms expire, processes double and spend transparency is lost. The price difference between managed and unmanaged procurement is 15–20%.
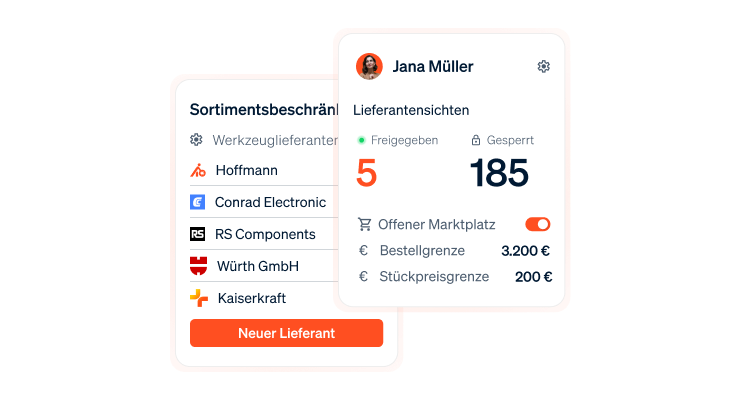
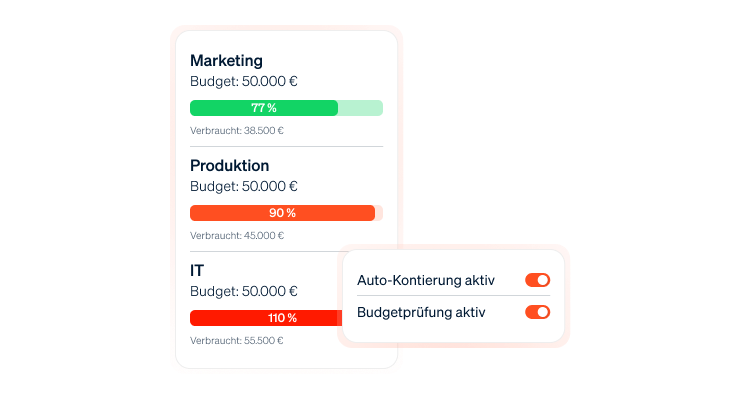
simple system makes the official path the easiest path: catalogs with approved items, negotiated prices, approval workflows, all in one interface that needs no training.
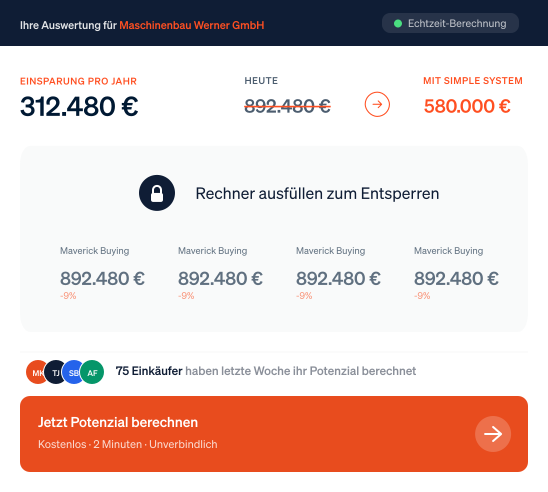
Example: At €5M procurement volume and a maverick buying rate of 30% (€1.5M), uncontrolled procurement costs the company at least €225,000–300,000 per year in lost terms, not counting the doubled process costs.
Key insight: every euro ordered outside the system costs the company twice, once in price, once in process.
A low item price is worthless if it hides manual approvals, paper invoices, reorders due to shortages and uncoordinated deliveries. The TCO view captures everything: ordering process, delivery time, invoice processing, warehousing, complaints.
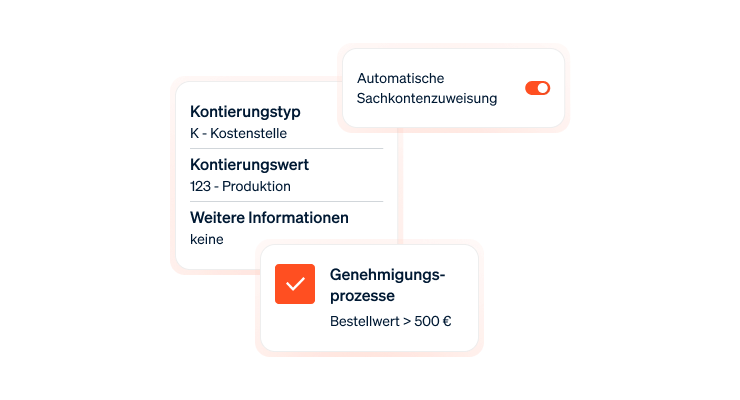
simple system makes TCO measurable: structured approval workflows, automatic general ledger account assignment, follow-up documents through to invoice approval and AI-supported classification across the entire spend volume.
Example: An item for €8.50 with a manual process (€146 process costs) totals €154.50. The same item for €9.20 through simple system (€86 process costs) costs €95.20. The "more expensive" item saves 38% in total costs.
Key insight: do not ask only "what does the item cost?", but "what does it cost us to procure this item?" The answer is usually 3 to 5 times the item price.
C-parts typically make up only 5% of purchasing volume, but cause up to 60% of the administrative effort. Every minute a buyer spends ordering office supplies or screws is missing from strategic negotiations on production material.
simple system takes over the C-parts process completely: catalog ordering, approval, goods receipt, follow-up documents, automated and without buyer intervention.
Example: A buyer with €120,000 in employer costs spends 40% of their time on C-parts. That is €48,000 per year for work a platform does in seconds. With three buyers: €144,000 in freed capacity, for strategic negotiations that pay off many times over.
Key insight: automation in C-parts procurement is not an IT project, it is a bottom-line decision. Every hour you free up from operational procurement becomes a strategic lever.

Without data there is no optimization. Many companies do not know who buys what from whom at which price. simple system delivers comprehensive spend analytics across all product groups, vendors and locations, the basis for any further optimization through assortment tenders or framework contract negotiations.
Example: Through spend analysis a company finds that three departments order the same item from different vendors, a price difference of 22%. Bundling to one vendor saves, at €200,000 annual volume, €44,000 immediately, and that is just one product group.
Key insight: transparency is not a software feature, it is the difference between procurement as an order desk and procurement as a strategic bottom-line lever.
HTWK Leipzig:
Procurement costs and digital platforms (inflation-adjusted to 2025)
Managing indirect procurement: success factors for performance and cost control
Kloepfel Consulting:
TCO analysis in procurement
McKinsey:
Indirect Procurement & EBITDA-correlation
Aim Higher and Move Faster
Deloitte:
Agents of Change: 2025 Global Chief Procurement Officer Survey
Meyer Industry:
Market analysis mechanical engineering Germany 2025