![Andy Freund [Senior Growth Manager]](https://simplesystem.com/hs-fs/hubfs/Autoren_Blog/Andy_Freund_autor.png?width=200&name=Andy_Freund_autor.png)

01.07.2026
![Andy Freund [Senior Growth Manager]](https://simplesystem.com/hs-fs/hubfs/Autoren_Blog/Andy_Freund_autor.png?width=768&name=Andy_Freund_autor.png)

Managing dozens, hundreds or even thousands of suppliers is a key challenge in modern procurement. The complexity can quickly become overwhelming, and the strategic importance of individual suppliers varies enormously. While some partners are critical to your success, others contribute only insignificantly to your value chain. Nevertheless, they all require resources: time, attention and administrative effort.
This is exactly where the ABC analysis for suppliers comes in. It is a proven business management tool that helps you to separate the essential from the non-essential. Instead of treating all suppliers the same, this method allows you to use data-based classification to target your resources where they have the greatest leverage. In this article, you will learn how to perform the ABC analysis step by step to professionalize your supplier evaluation and optimize your procurement.
The ABC analysis is a method for classifying objects into three classes (A, B and C) according to their respective importance. In the context of supplier management, suppliers are evaluated and classified on the basis of a relevant key figure - usually the purchasing volume or turnover over a certain period of time. The classification is usually based on the Pareto principle, which states that a small part of the cause (supplier) is responsible for a large part of the effect (purchase value). The aim of the ABC analysis is to prioritize:
Carrying out an ABC analysis is more than just a theoretical exercise. It forms the basis for strategically oriented procurement and differentiated supplier management. By classifying your suppliers, you shift the focus from purely operational to value-oriented management of your supplier relationships. The results of the ABC analysis enable concrete improvements in several areas of the company.
The theoretical basis of the ABC analysis is the Pareto principle named after Vilfredo Pareto, often also known as the 80/20 rule. It describes the statistical observation that in many cases around 80 percent of the results are achieved with only 20 percent of the total effort. Applied to supplier management, this means A small percentage of your suppliers (the A-suppliers) are responsible for a very large proportion of your total purchasing volume.
Conversely, a large number of suppliers (the C suppliers) are only responsible for a small proportion of the total value. This uneven distribution is the key to prioritization. The division into A, B and C is an extension of this principle to enable a more differentiated view.
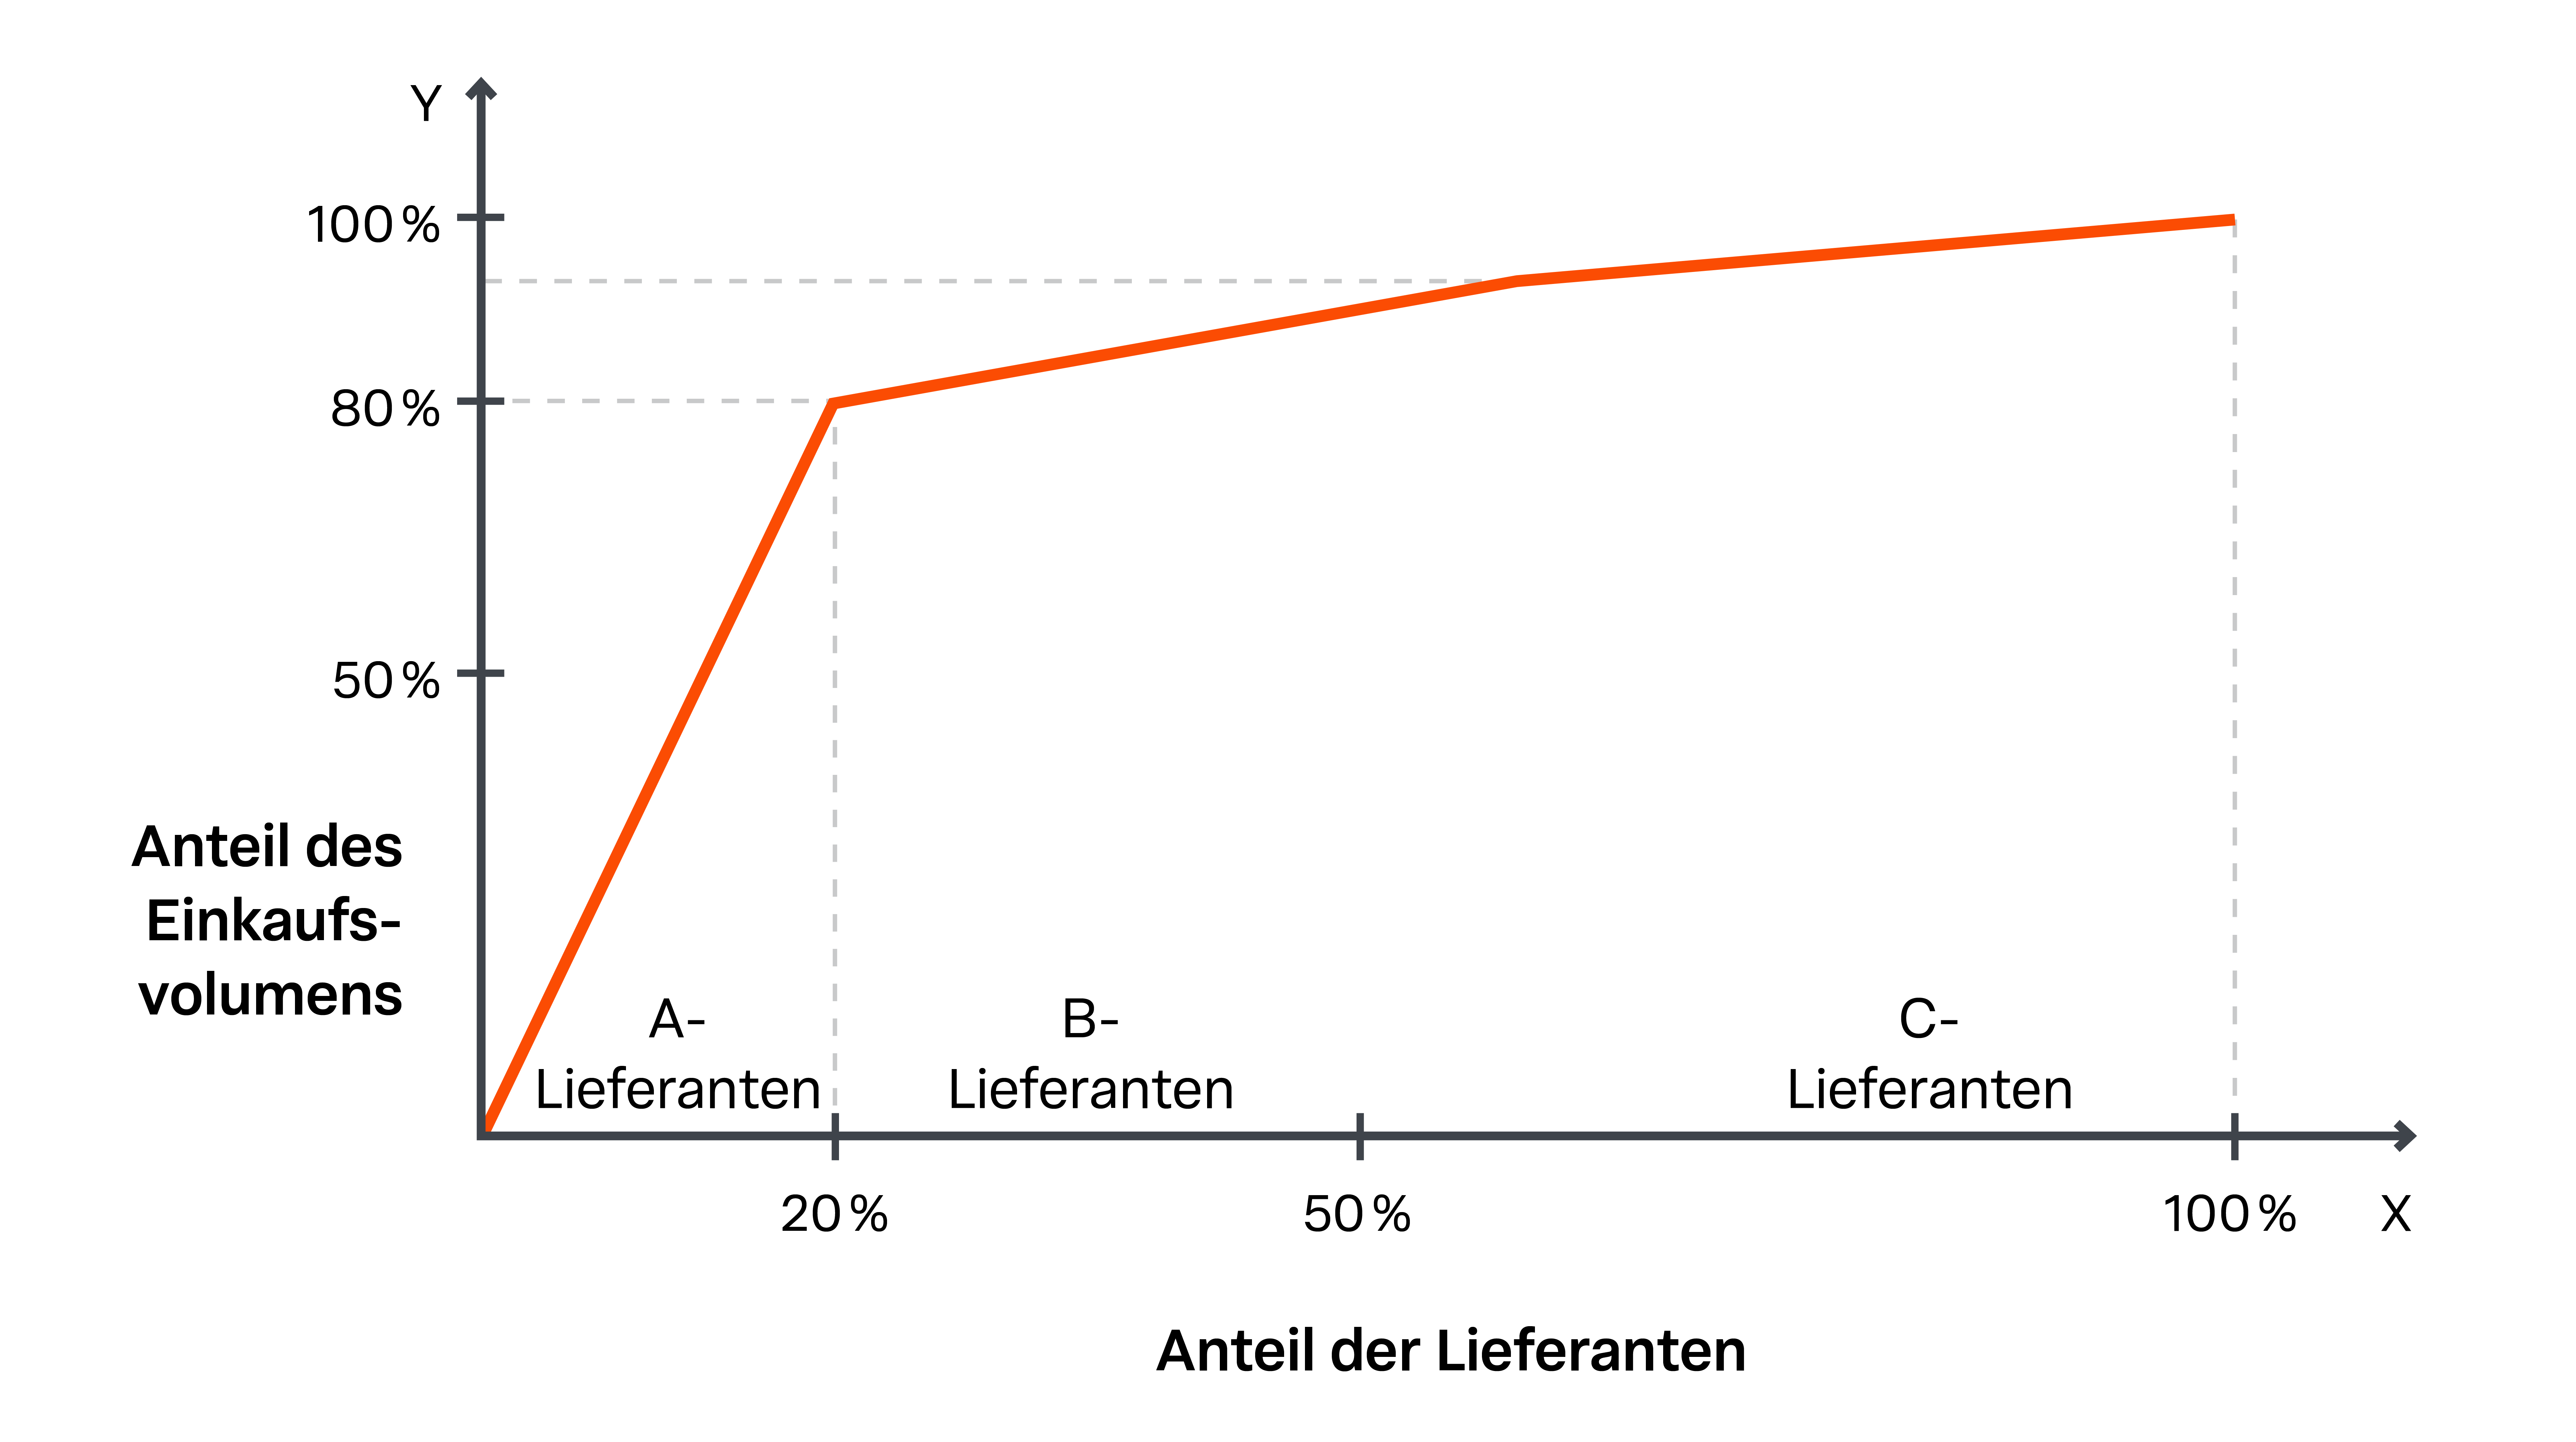
This distribution can be represented graphically with a Lorenz curve. It visualizes how strongly the cumulative value share is concentrated on the cumulative number of suppliers and makes the class boundaries between the three classes A, B and C clearly visible.
Performing an ABC analysis is straightforward and does not require any special software. A standard spreadsheet program such as Microsoft Excel is perfectly adequate. The method is based on a clear, comprehensible procedure that you can implement in four steps. The aim is to create a clean data basis in order to classify your suppliers objectively.
The basis of any analysis is a reliable set of data. Collect the relevant data for all your suppliers over a meaningful period of time, usually the last 12 months. The most important key figure is almost always the purchasing volume (turnover) that you have made with each individual supplier. Make sure the data is complete and cleansed to avoid distortions. Although turnover is the most common metric, other criteria such as contribution margin or order frequency can also be used depending on your objectives.
Once you have recorded the data for each supplier, add it up to determine the total purchasing volume. Then calculate the percentage share of the total value for each supplier. To determine the ranking, sort the list of your suppliers in descending order according to this value share. The supplier with the highest purchasing volume is in first place, the one with the lowest in last place.
This step is decisive for the subsequent classification. You form a cumulative total of the percentage value shares. Start with the supplier at the top of the ranking list. Its value share is the first cumulative value. Add the value share of the second-placed supplier to this to obtain its cumulative value. Continue this for the entire list until you reach 100% for the last supplier. This cumulative column shows you which percentage of the suppliers are responsible for which percentage of the total value.
Now the actual classification into the three classes A, B and C takes place. The definition of the class boundaries is based on the Pareto principle, but is not rigid. Typical boundaries that have proven themselves in practice are
Now assign the appropriate class to each supplier based on their cumulative value share. It is important to understand that these percentages are guidelines. Depending on the structure of your supplier base, you can adjust these limits to achieve a categorization that makes sense for your company.

Find out how in our free e-procurement report. Download now for free and without obligation.
Read nowTo make the theory more tangible, let's look at a simplified example. A company has 10 suppliers with a total purchasing volume of €2,000,000 per year. After carrying out the above steps, the following table results:
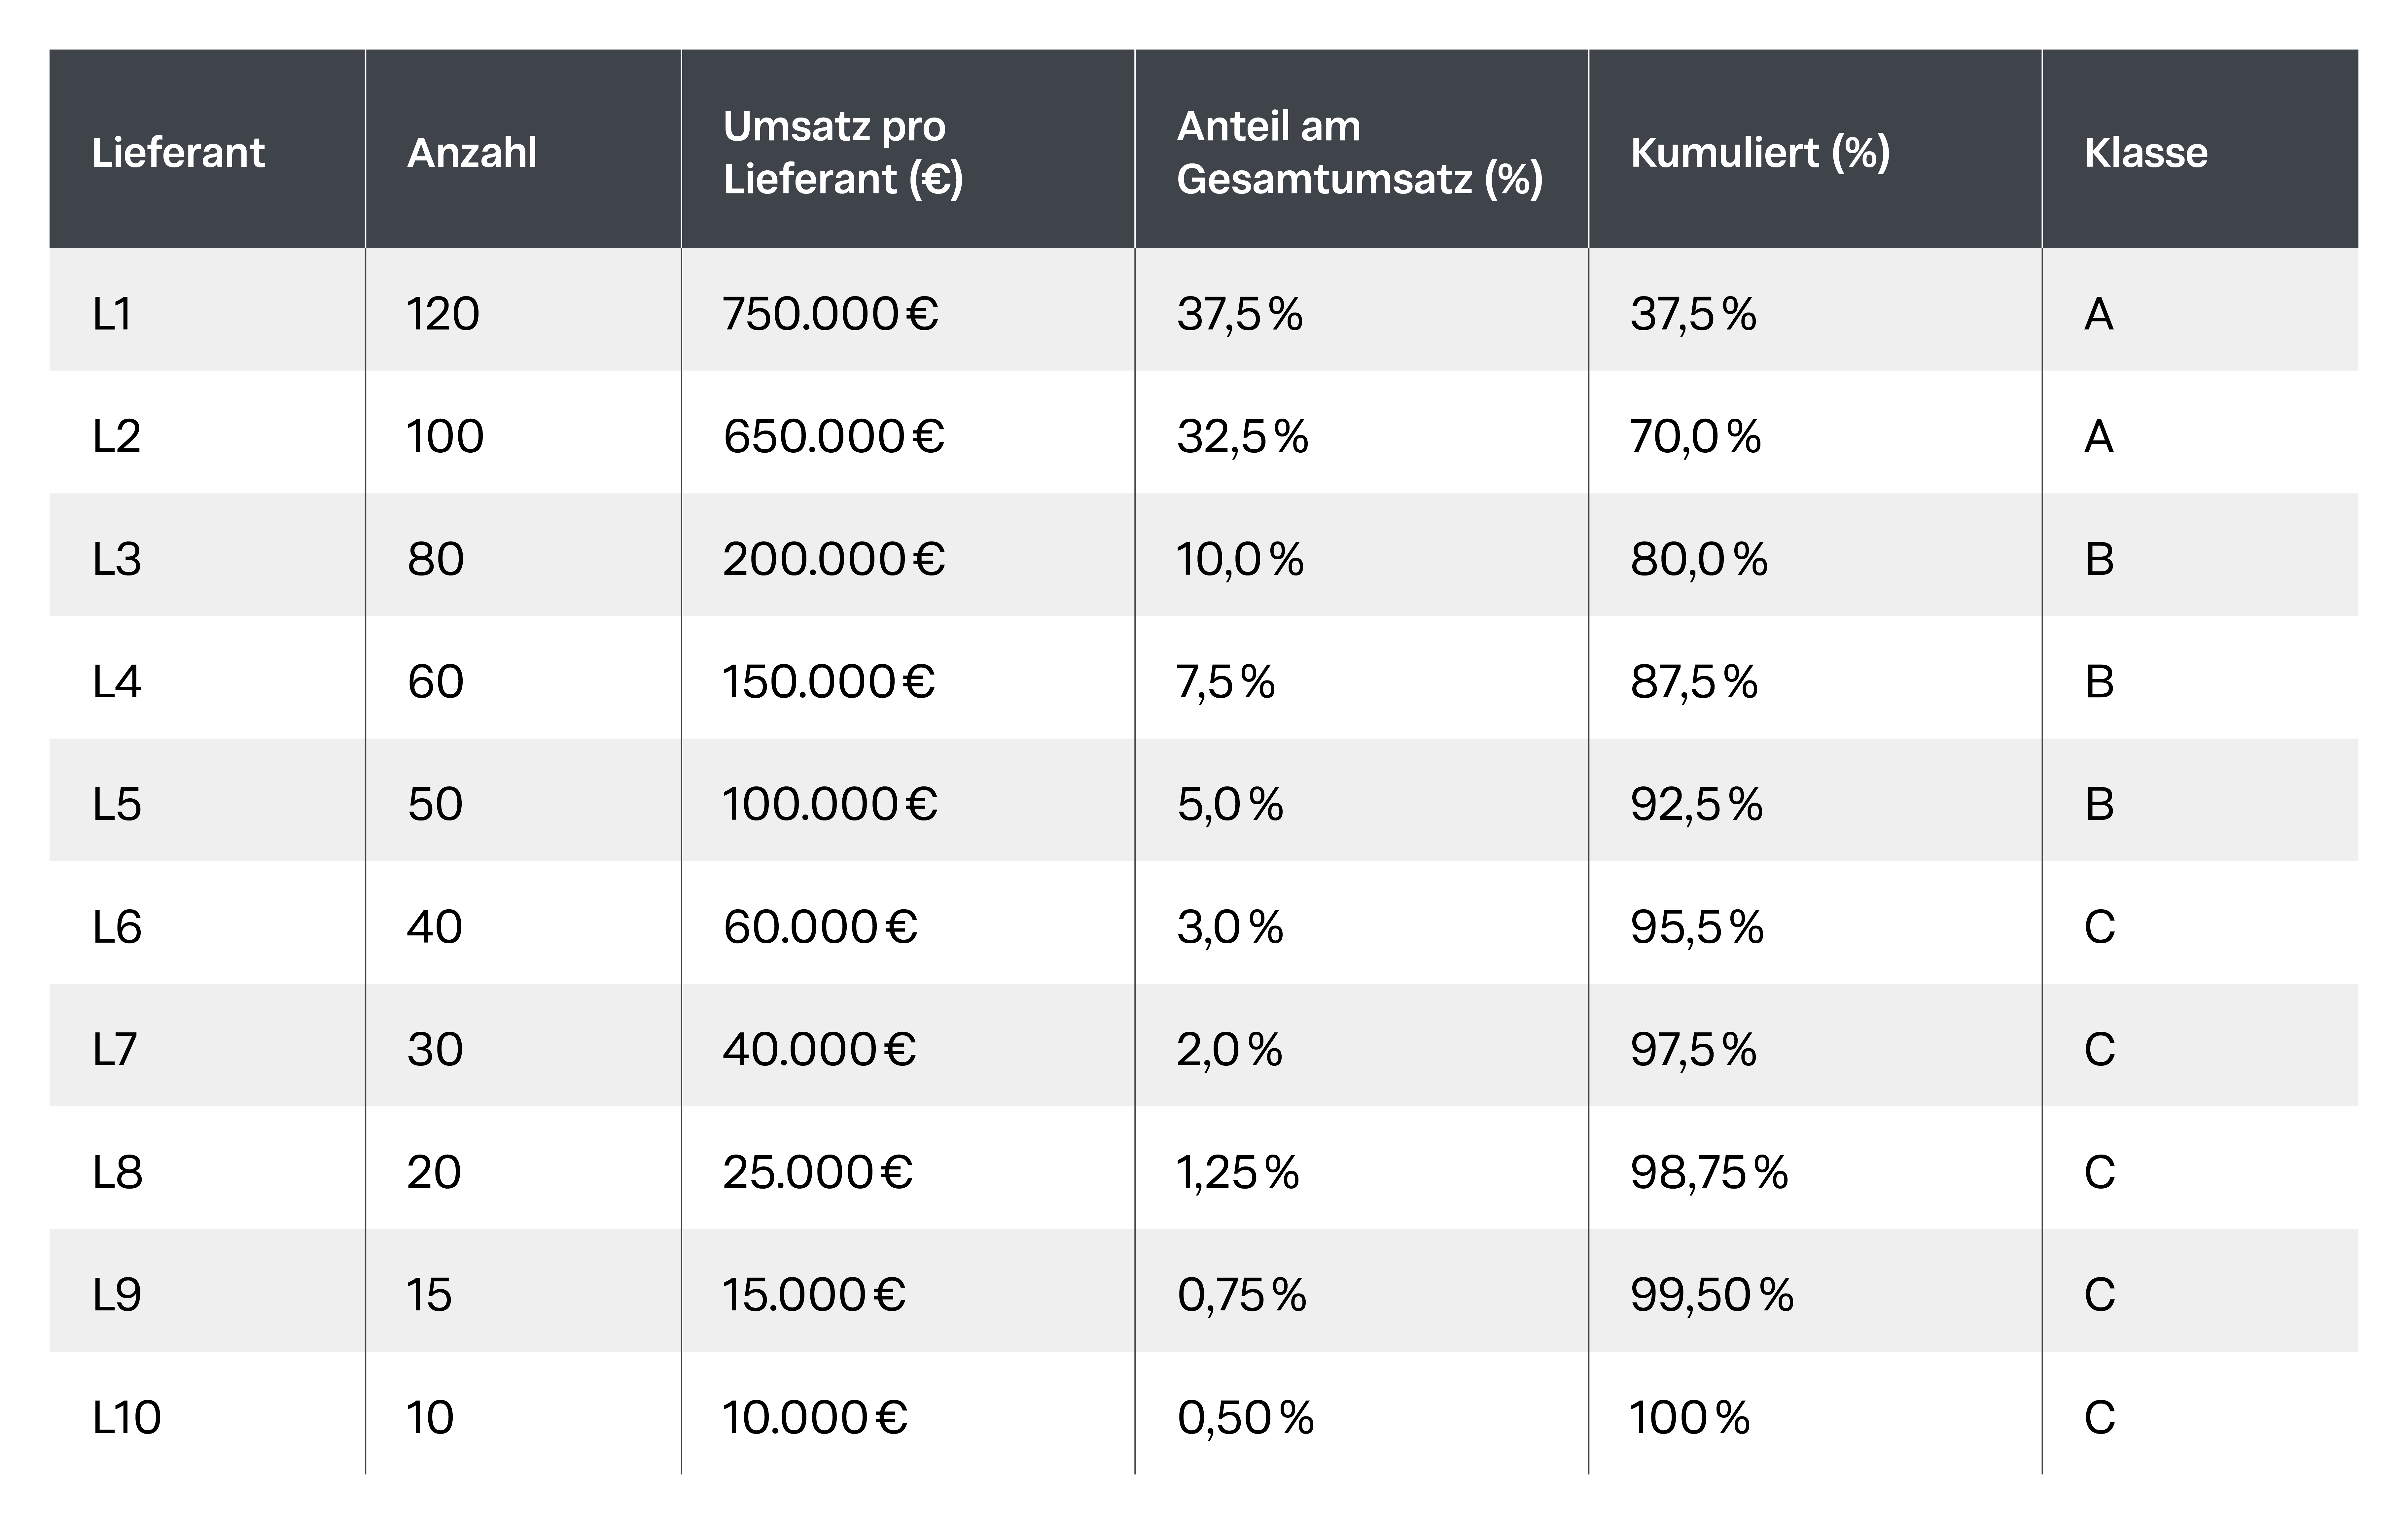
In this ABC analysis example, the unequal distribution is immediately visible. Only two out of ten suppliers (20% of the volume) fall into class A, but are responsible for 75% of the total purchasing value. These partners are of outstanding strategic importance to the company. Three other suppliers are class B and account for 20% of the value. The remaining five suppliers - i.e. half of all suppliers - fall into the C category and together account for only 5% of the purchasing volume. The results of the ABC analysis thus provide a crystal-clear basis for setting priorities in supplier management.
The classification of your suppliers into the three classes A, B and C is not an end in itself. Their true value only unfolds through the derivation of specific strategies and measures tailored to the respective category. The results of the ABC analysis provide the data-supported basis for differentiating your supplier management and managing your resources effectively. Instead of treating all partners equally, you can now develop prioritized support concepts that take into account both the value contribution and the effort required.
Your A-suppliers are the strategic partners who have a disproportionate influence on your business success. Intensive cooperation based on partnership is essential here. The focus is on joint value creation and securing the supply chain. Maintain close relationships at several levels, hold regular strategy meetings and develop common goals. Long-term framework agreements, transparent performance measurement and joint innovation projects are typical instruments. At the same time, the high level of dependency requires proactive risk management. Analyze potential default risks and develop contingency plans to ensure security of supply for this critical supplier group at all times.
B suppliers form the midfield. They are of moderate importance to your company and require a balanced management approach. The aim is to increase efficiency through standardization without completely anonymizing the relationship. Establish standardized processes for ordering, communication and performance evaluation.
Conduct regular but less intensive supplier meetings than for the A category. Check these suppliers specifically for potential for bundling requirements or optimizing delivery conditions. It is also worth analyzing whether a B-supplier has the potential to be developed into an A-supplier or whether a shift to the C-category would make sense through a realignment of procurement.
The large group of C-suppliers is responsible for a very low proportion of value, but often causes a high level of administrative effort. The leverage here lies not in the negotiation of individual prices, but in the radical minimization of process costs. The ultimate goal is to automate procurement processes. Implement e-procurement solutions, use electronic catalogs (e.g. via OCI/Punchout) or introduce purchasing cards (P-Cards) for low-value requirements. Bundle orders to reduce the number of transactions and consider consolidating suppliers. Support for this C category should be automated as far as possible and based on the "no-touch" principle in order to free up your purchasing resources for the more strategically important A and B suppliers.
Despite its undeniable advantages, the classic ABC analysis also has disadvantages and limitations. Its greatest weakness is its one-dimensional approach. As a rule, it is based exclusively on a single quantitative key figure, usually the purchasing volume. Qualitative and strategic factors such as delivery reliability, innovation potential, technological dependency or supplier risk (e.g. in the case of a single-source supplier) are not taken into account. A supplier with a low turnover (C-supplier) may be responsible for a critical, non-substitutable component and would therefore be of high strategic importance. To obtain a more comprehensive picture, the ABC analysis can be combined with other methods.
A very useful extension is the combination with the XYZ analysis. This classifies objects not according to their value, but according to the regularity of their consumption or orders:
The combination of both analyses in an ABC/XYZ matrix enables significantly more differentiated control. An AX supplier (high value, constant demand) is an ideal candidate for just-in-time concepts. A CZ supplier (low value, sporadic demand), on the other hand, requires a procurement strategy aimed at minimal management effort and demand-oriented, simple orders. This multi-dimensional approach leads to a much more precise and effective supplier strategy.
The ABC analysis is more than just a calculation model; it is a compass for modern purchasing. By separating the essentials from the non-essentials, you can reduce operational hectic and instead build genuine strategic partnerships. Although the pure sales analysis does not always provide the full picture - which is why extensions such as the XYZ analysis are useful - it is indispensable as a starting point for professional supplier management. Use the transparency gained to finally deploy your resources where they create the greatest business value.

